[R, Python이 곽광받는 이유]:
엑셀과 엑세스를 이용하여 데이터를 처리할 수 있지만, R과 Python을 이용하면 대용량 데이터를 처리할 수 있기 때문.
R 프로그램 다운로드
www.r-project.org
--download R
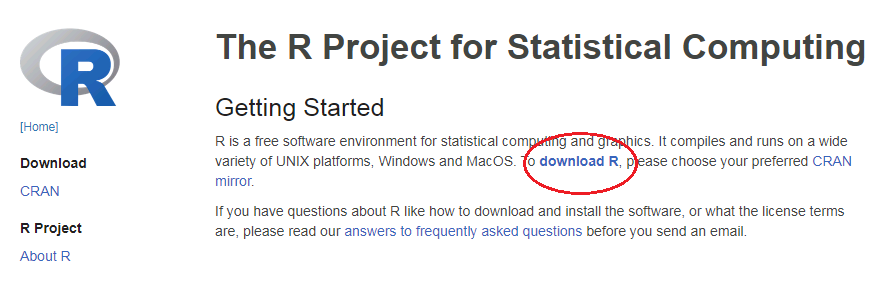
--korea

--Download R 3.6.1 for Windows
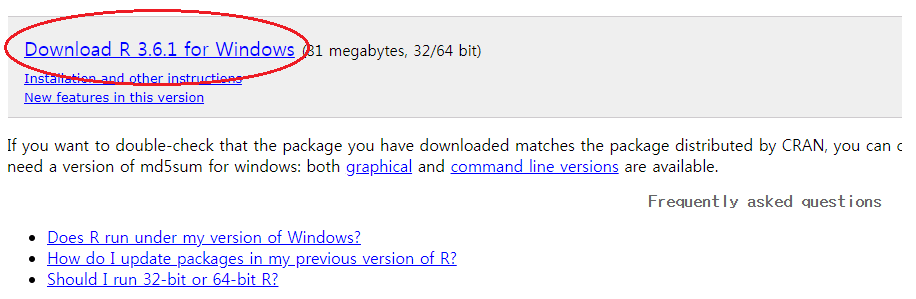
--complete

◆ R 프로그램에서 실행시켜봅시다.
아래와 같이 콘솔과 같은 화면이 나옵니다.

◆ score 에 3 값을 넣어준 후 " score <-3"
score로 그 값을 알아봅시다

◆ mean(score) 평균
median(score) 중앙값
var(score) 분산
sd(score) 표준편차
위의 명령어를 사용하여 아래와 같이 해당 값을 조회할 수 있습니다.

◆ height라는 변수에 mean 평균값 168 , 표준편차 7 값을 넣어준 후
히스토그램을 그려주는 함수를 사용하여 봅시다

위와 같은 값은 넣어준 히스토그램이 나옵니다.
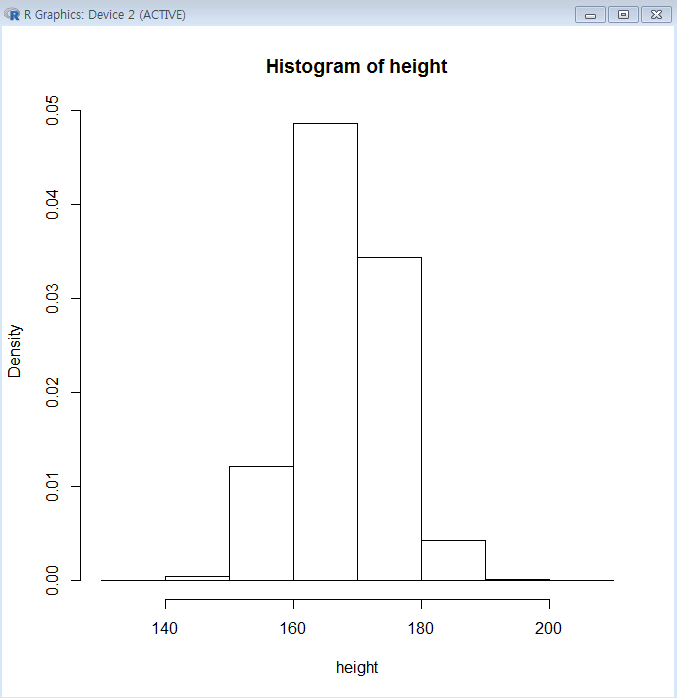
라인을 그려주는 함수
lines(density(height, bw=0.5), col="red", lwd=1)

만들어진 히스토그램 저장하기
savePlot("hist_4.png", type="png")
지정해준 작업 디렉터리에 위에서 정해준 파일이 저장되었습니다.
패키지 설치하기

[01] Yeaterday노래가사와 단어빈도수에 따른 WordCloud 생성하기

------------------------------------------------- yesterday.txt
Yesterday
all my troubles seemed
so far away
Now it looks as though
they're here to stay
Oh I believe in yesterday
Suddenly
I'm not half the man
I used to be
There's a shadow
hanging over me
Oh yesterday came suddenly
Why she had to go
I don't know she wouldn't say
I said something wrong
now I long for yesterday
Yesterday
love was such an easy
game to play
Now I need a place to hide away
Oh I believe in yesterday
Why she had to go
I don't know she wouldn't say
I said something wrong
now I long for yesterday
Yesterday
love was such an easy
game to play
Now I need a place to hide away
Oh I believe in yesterday
-------------------------------------------------


ex) 간단한 텍스트 마이닝 연습
-------------------------------------------------
#텍스트 읽기
> lyrics<-scan("yesterday.txt", what="character")
> str(lyrics)
> head(lyrics)

#텍스트 전처리
> grep(",", lyrics)
> grep("\\.", lyrics)
> grep("\\!", lyrics)
> grep("\\?", lyrics)

> lyrics.1<-gsub(",","",lyrics)
> lyrics.1<-gsub("\\.","",lyrics.1)
> lyrics.1<-gsub("\\!","",lyrics.1)
> lyrics.1<-gsub("\\?","",lyrics.1)

#빈도 시각화
> tab.1<-table(lyrics.1)
> tab.2<-sort(tab.1, decreasing=TRUE)
> tab.2a<-tab.2[tab.2>1]
> par(mar=c(4,6,4,4))
> barplot(rev(tab.2a), horiz=TRUE, las=2, main="Beatles' Yesterday", col="lightblue")


#wordcloud 패키지 설치
> library(wordcloud)
> windows(width=4, height=4); par(mar=c(2,2,2,2))
> set.seed(12345)
> wordcloud(words=names(tab.1), freq=tab.1, scale=c(5,0.5), min.freq=1, colors=rainbow(10), random.color=FALSE, random.order=FALSE, rot.per=0.25)
-------------------------------------------------
위의 yesterday를 txt로 작업공간에 저장을 시켜 줍니다.
아래에 보이는 텍스트마이닝 부분을 따라하다 보면 결과물이


글에 나오는 단어들의 빈도를 시각화 해서 보여주게 됩니다.